Cloud & Infrastructure · AI Infrastructure
AI on Kubernetes: the 5% GPU utilization problem

TL;DR
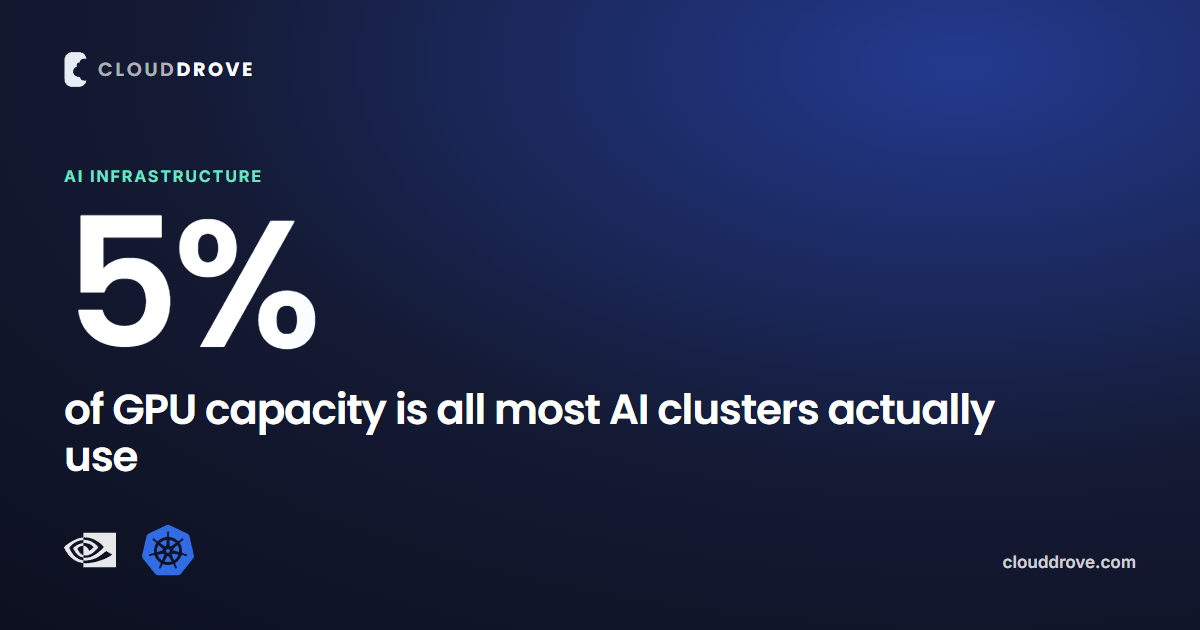
- Average GPU utilization across production Kubernetes clusters is 5%, meaning most teams are paying for roughly 20x the GPU capacity their workloads actually use at any given moment.
- Inference workloads rarely exceed 40% utilization even when busy. Training can hit 85 to 95%. Teams that provision inference like training pay for the gap every month.
- An idle H100 on AWS costs about $8,850 per GPU per month. A single 8-GPU p5.48xlarge left running is roughly $39,600 a month at current on-demand pricing.
- Agentic workflows compound it: a task that chains 20 LLM calls burns 20x the tokens of one call, and most teams have no per-step breakdown to see where the spend is going.
Every FinOps report in 2026 says the same thing: AI spend went from a rounding error to the line item finance asks about every month. What most of those reports skip is the specific, fixable reason it's so expensive. It isn't just that GPUs cost more than CPUs. It's that the GPUs running AI workloads on Kubernetes today are mostly sitting idle while the bill keeps running.
The number: 5% average utilization
Cast AI's 2026 State of Kubernetes Optimization Report analyzed tens of thousands of production clusters across AWS, GCP, and Azure and found average GPU utilization sitting at 5%. That means, on average, teams have roughly 20 times as much GPU capacity provisioned as their workloads consume at any given moment. It varies by managed Kubernetes service, AKS clusters average 2% utilization, EKS 5%, GKE 6%, but none of them are close to the number that would justify what's being spent.
Checking your own numbers takes one command, and it's usually more revealing than teams expect. GPU memory can show as fully allocated while compute sits nearly idle, because most teams size pods by memory headroom, not actual compute usage:
$ kubectl exec -it inference-7d9f8c -- nvidia-smi --query-gpu=utilization.gpu,memory.used --format=csv,noheader
# three samples, five seconds apart
12 %, 22140 MiB
9 %, 21870 MiB
14 %, 23012 MiB
Memory usage above 20GB looks like a fully loaded GPU. Compute utilization in the 9 to 14% range says otherwise. The model is loaded and ready, it just isn't being asked to do much most of the time, and the cluster is billed for the full card regardless.
Why inference wastes more than training
Training and inference behave completely differently on a GPU, and provisioning them the same way is where most of the waste comes from. Training jobs are batch workloads, feed the GPU a large batch, keep it saturated for hours. Inference is bursty by nature: a request comes in, the GPU does a few hundred milliseconds of work, then waits for the next one.
The mistake is provisioning inference capacity the way you'd provision training capacity, one dedicated GPU per service, sized for the worst-case burst, running 24/7. That pattern makes sense for a training job that finishes in six hours. It's expensive idle time for a chat endpoint that gets real traffic for twenty minutes out of every hour. Techniques that actually fit inference's bursty pattern, request batching, GPU time-slicing, MIG partitioning on supported hardware, and scale-to-zero for low-traffic endpoints, close most of that gap, but they require treating inference as its own scheduling problem instead of a smaller version of training.
The token multiplier nobody's tracking
GPU waste is the infrastructure half of the problem. The other half shows up one layer up, in how agentic workflows consume tokens. An agentic step in 2026 routinely passes 50,000 input tokens once you count context, tool definitions, and prior steps. A workflow that chains 20 LLM calls to complete one task consumes roughly 20x the tokens of a single request, and neither the engineers who built the workflow nor the finance team reviewing the bill typically sees a breakdown by step. It shows up as one number at the end of the month.
Pricing makes this worse before it gets better: as of mid-2026, per-million-token pricing spans roughly $0.10 to $10.00 across providers and tiers, a 100x spread for the same basic capability, and output tokens run 4 to 6x the price of input tokens on top of that. Routing a step to the wrong model tier, or letting output run longer than it needs to, compounds fast across a 20-step chain. The FinOps Foundation's framing on this is worth sitting with: cost-per-token isn't the metric that aligns engineering to business outcomes, cost-per-successful-output is. A cheap workflow that fails and retries three times isn't actually cheap.
What to check in your own cluster
Four checks, in the order they actually pay off. Visibility first, then scheduling, then the AI-specific layer on top.
Pull real utilization numbers
nvidia-smi or a GPU-aware monitoring tool, not kubectl top, which only shows memory and CPU.
Split inference from training
Different scheduling strategies. Don't size a bursty chat endpoint like a six-hour training batch.
Get a per-step token breakdown
On your agentic workflows, before optimizing anything else. You can't fix what you can't see by step.
Check for scale-to-zero
Low-traffic inference endpoints shouldn't hold a GPU 24/7 between requests.
Common mistakes
- Provisioning by worst-case burst instead of real traffic patterns. One dedicated GPU per service is the simplest thing to configure and the most expensive thing to run.
- Treating GPU memory allocation as a proxy for GPU usage. A fully loaded model on an idle GPU still shows 20GB+ used and looks "busy" on the wrong dashboard.
- Optimizing cost-per-token instead of cost-per-successful-output. A cheaper model that needs two retries to get a usable answer isn't actually cheaper.
- No ownership of AI infrastructure cost. When nobody's job is to watch GPU utilization specifically, it drifts toward whatever's easiest to provision, not what's efficient to run.
References
- 2026 State of Kubernetes Optimization Report, Cast AISource for the 5% average GPU utilization figure and the AKS/EKS/GKE breakdown, based on analysis of tens of thousands of production clusters across AWS, GCP, and Azure.